The Facts
Hospitals:
Nearly half of Australian hospitals are private.In 2014-15 there were 1322 hospitals in Australia, 624 of which were private. (AIHW, 2014-15, p3) |
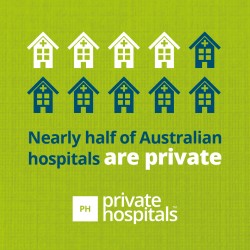 |
1 in 3 hospital beds are private.There were 92,100 hospital beds in Australia, about 32,000 were private hospital beds and chairs (about 28,551 in overnight hospitals and 2,763 in free standing day hospitals). (AIHW, 2014-15, p4, Figure 1) |
|
Nearly 1 in 3 (32%) patient days occur in private hospitals.In 2014–15, there were 28.8 million patient days in Australia, 9.39 million of which occurred in private hospitals. (AIHW, 2014-15, p16, Table 5) |
Demographics:
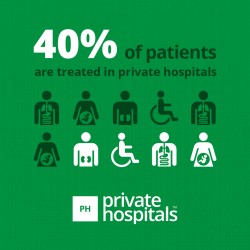
2 in 5 (40%) patients are treated in private hospitals.In 2015-16, private hospitals treated 4,327,287 out of a total of 10,599,768 hospital separations for admitted patients. These included acute, sub-acute and non-acute separations. (AIHW, 2015-16) |
 |
More patients aged 55–74 are treated in private hospitals than other age groups.In 2011–12, nearly 3 in 5 (59%) separations in private hospitals were for persons aged 55 and older. Half (52%) of public patients were in the same age bracket. Only 1 in 12 (8%) private separations were for patients younger than 25. 1 in 6 (16%) public patients were aged younger than 25. (AIHW, 2011–12, p160–1, Tables 7.38 and 7.39) |
|
More women than men are treated in private hospitals.In 2011–12, more than half (54.7%) of separations in private hospitals were for female patients. This proportion has been steadily declining over the past decade, from 55.5% of separations in 2001–02, despite private hospital separations increasing over the same period. The proportion of separations for female patients was higher than the distribution of women in the Australian population as a whole (50.2%) and higher than the gender distribution of insured persons (51.4% of insured persons were female in the September quarter 2013). (AIHW, 2011–12, p160–1, Tables 7.38 and 7.39; AIHW Australian hospital statistics for previous years; ABS 2013, Cat no 3222.0; PHIAC September data) |
Treatments:
3 in 5 (59%) surgeries are performed in private hospitals.In 2011–12, 2,338,015 separations were defined as acute care with a surgery procedure reported. 1,387,384 of those occurred in private hospitals. (AIHW, 2011–12, p114, Table 7.1) |
 |
2 in 3 (66%) elective surgeries are performed in private hospitals and day surgeries.In 2011–12, private hospitals and day surgeries treated 1,339,422 out of total 2,015,570 elective admissions (separations) involving surgery. (AIHW, 2011–12, p213, Table 10.3) |
|
Nearly three in four (73%) hospital-admitted dental procedures occur in private and day hospitalsIn 2014–15, private hospitals and day surgeries provided 114,343 dental procedures for same-day and overnight separations (110,837 and 3,506 respectively) out of a total of 263,369 procedures. (AIHW, 2014-15, p146, 148, 151, Tables 6.3, 6.5, 6.8) |
|
Private hospitals and day clinics provide more than 2 in 5 (46%) chemotherapy treatments.In 2011–12, the total number of chemotherapy treatments was 497,486. Private and day hospitals provided 226,933 same-day acute separations related to chemotherapy. The number of overnight separations involving chemotherapy was unknown. Public hospitals provided the remaining 141,876 (38%) same-day acute separations in that year. Additionally, public hospitals provided 128,677 outpatient care individual occasions of service related to chemotherapy. (AIHW, 2011–12, p104, 174, Tables 6.4 and 8.11) Slightly more than half (53%) of hospital separations where the principal diagnosis was neoplasms (cancer) occurred in private hospitals (317,824 out of 595,279). (AIHW, 2011–12, p128, Table 7.10) |
 |
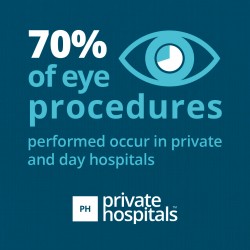
7 in 10 (73%) eye procedures performed occur in private and day hospitals.In 2011–12, private hospitals and day surgeries provided 227,106 out of total 319,915 procedures related to diseases of the eye and adnexa. Private hospitals and day surgeries provided 216,650 (73%) out of total 296,665 procedures for same-day separations. Additionally, private hospitals provided 10,456 (45%) out of total 23,250 procedures for overnight separations related to diseases of the eye and adnexa. Similarly, 71% of all hospital separations where the principal diagnosis was diseases of the eye or the adnexa occurred in private hospitals. (AIHW, 2011–12, p175, 196, Tables 8.12, 9.12; AIHW 2011–12, p128, Table 7.10) |
 |
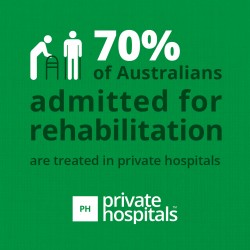
7 in 10 (70%) Australians admitted for rehabilitation are treated in private hospitals.In 2011–12, private hospitals treated 226,887 out of total 322,449 separations related to rehabilitation care. The private hospital services involved 1,051,109 patient days. Admitted patient data do not cover all rehabilitation work in Australia. These figures do not include rehabilitation services delivered in outpatient settings. (AIHW, 2011–12, p137, Table 7.20) |
 |
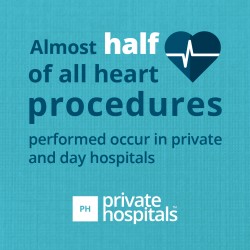
Almost half (47%) of heart procedures are performed in private and day hospitals.In 2011–12, private hospitals provided 89,592 (46%) out of 194,910 procedures for overnight acute separations related to the cardiovascular system. Additionally, private and day hospitals provided a further 45,133 (50%) out of 91,012 procedures for same-day separations. (AIHW, 2011–12, p175, 196, Tables 8.12, 9.12) |
 |
Workforce:
Working in private hospitals means you never stop learning new skills. |
|
18% of the hospital sector workforce are employed by private hospitals.In 2011–12, 328,345 people (full-time equivalent staff) were working in hospitals in Australia. 57,495 of these were employed in private hospitals. Note that these figures do not include doctors credentialed to admit patients to private hospitals and staff employed by agencies or contracting services to patients in private hospitals. (AIHW, 2011–12, p12, Table 2.5; ABS 2013) |
|
21% of the nursing workforce is employed by private hospitals.In 2011–12, there were 155,585 full-time equivalent enrolled and registered nurses working in Australian hospitals. 32,217 of these were employed in private hospitals. (AIHW, 2011–12, p12, Table 2.5; ABS 2013) |
|
35% of hours worked by nurses occurred in private settings.In 2012, there were a total of 19.0 million hours worked by nurses in Australia. 6.6 million of those hours were worked in private settings. (HWA database) |

© Copyright Australian Private Hospitals
